The Kilo-Degree Survey spent eight years observing three areas of the southern sky in great detail.
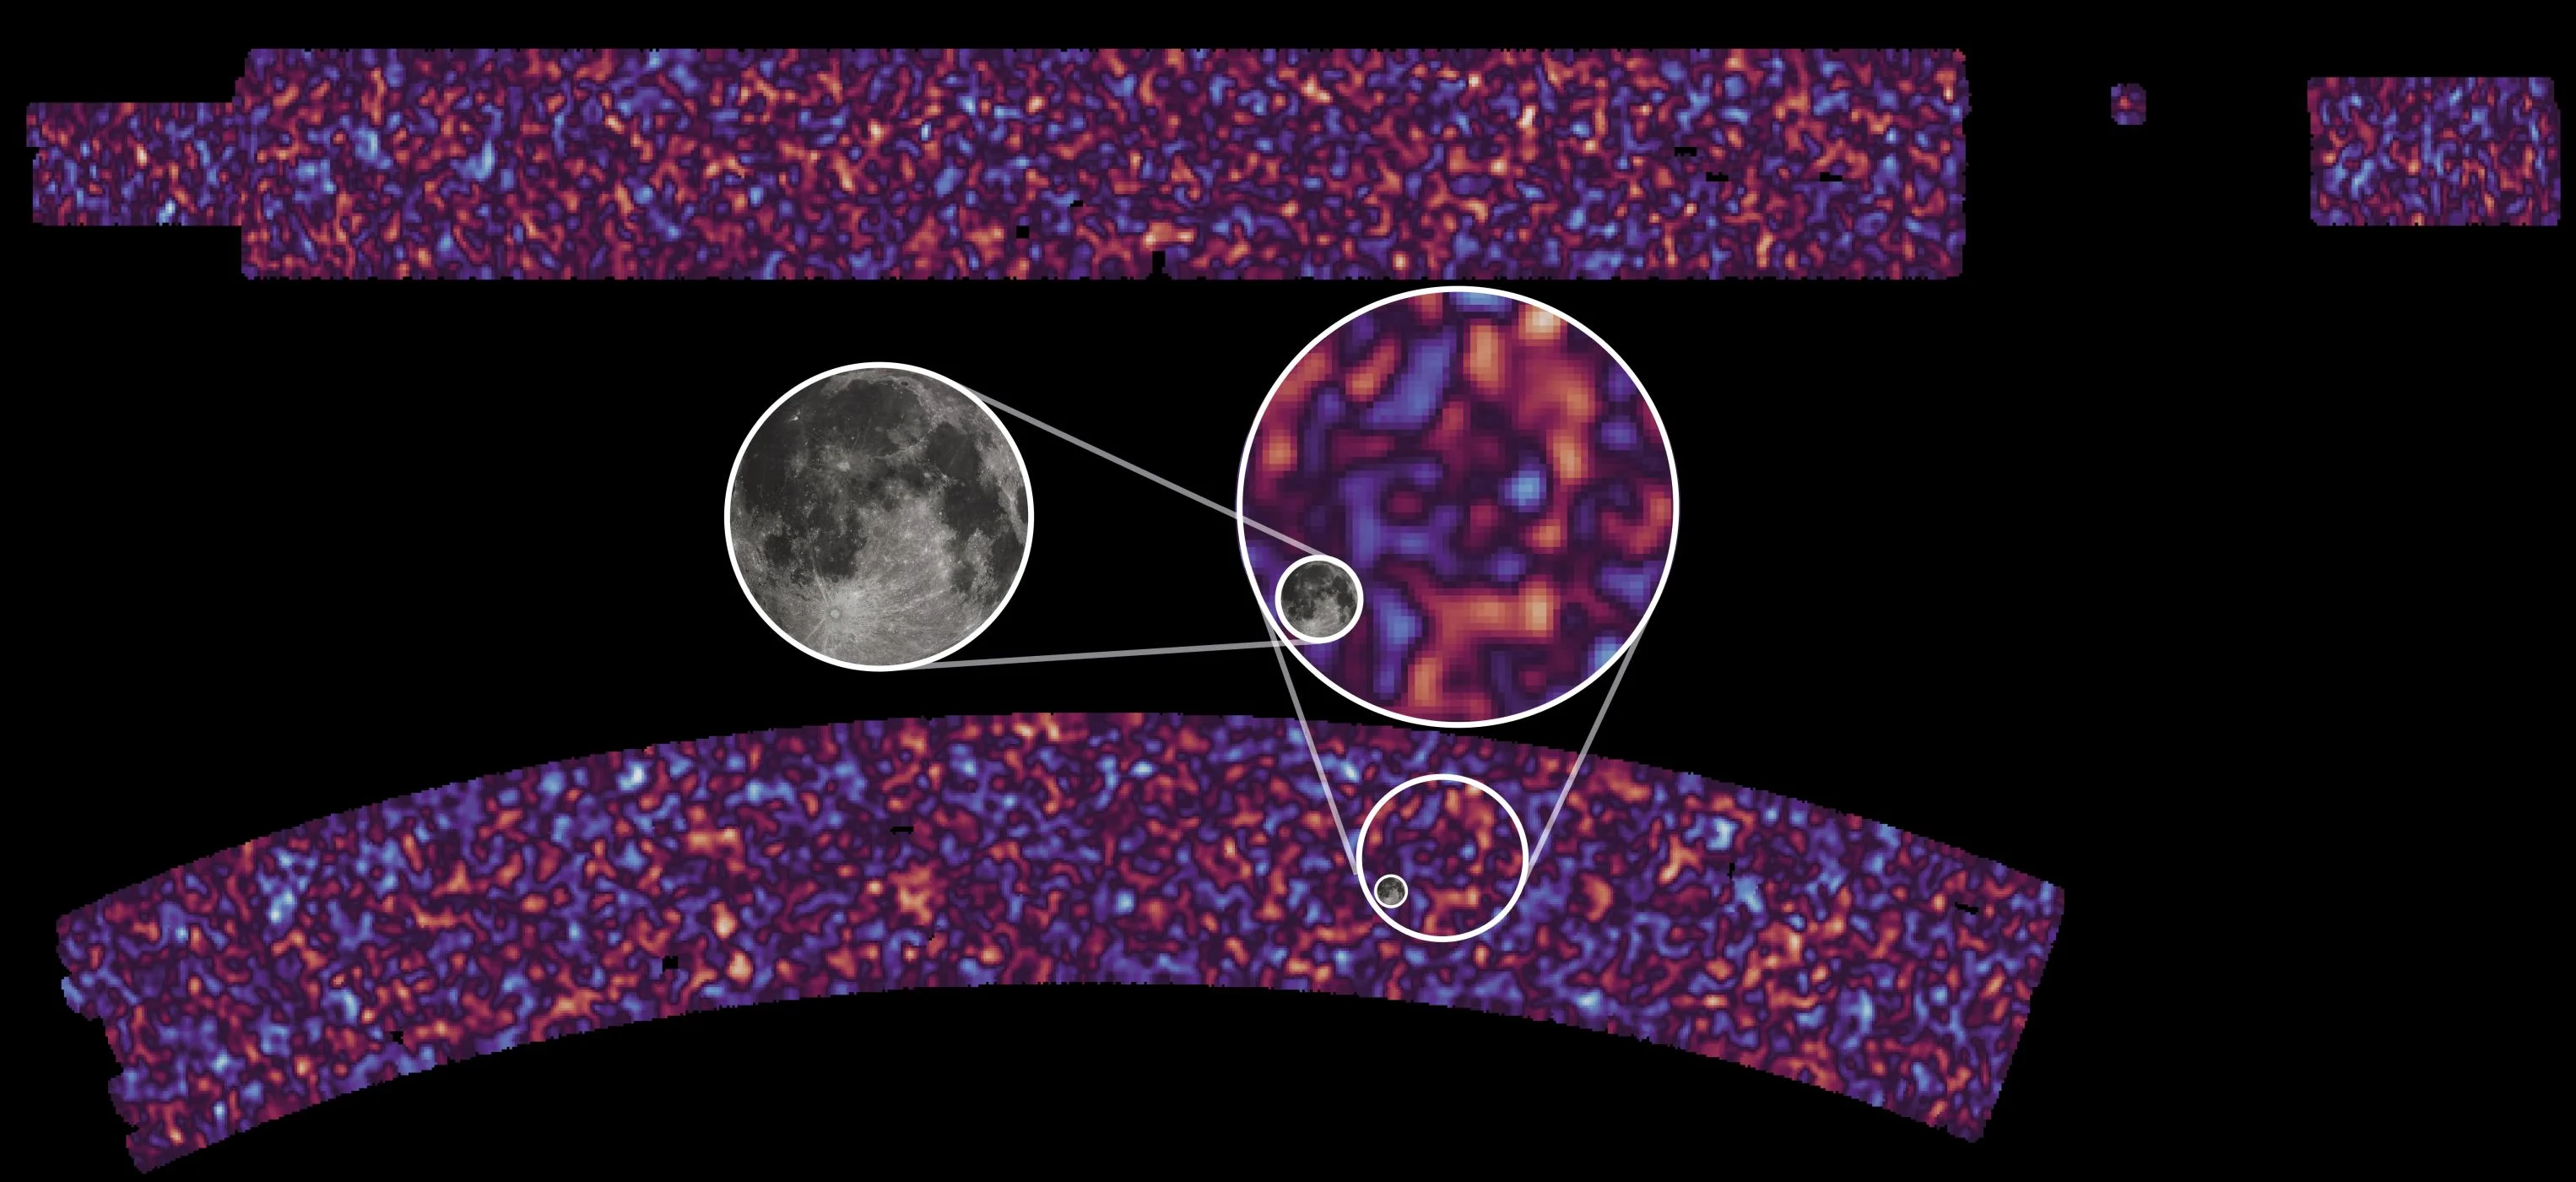
The researchers then used the data to estimate the distribution of matter. Areas with a particularly high density of matter are highlighted in red, areas with a particularly low density in blue. In the center you can see a section of the map in comparison with the size of the full moon.
